
Conversions and carts
The SweeAnalytics Conversions view shows how many visitors to your ticketing page go all the way to purchase, and which tickets sell best. Open it from the left menu, under the event’s name.
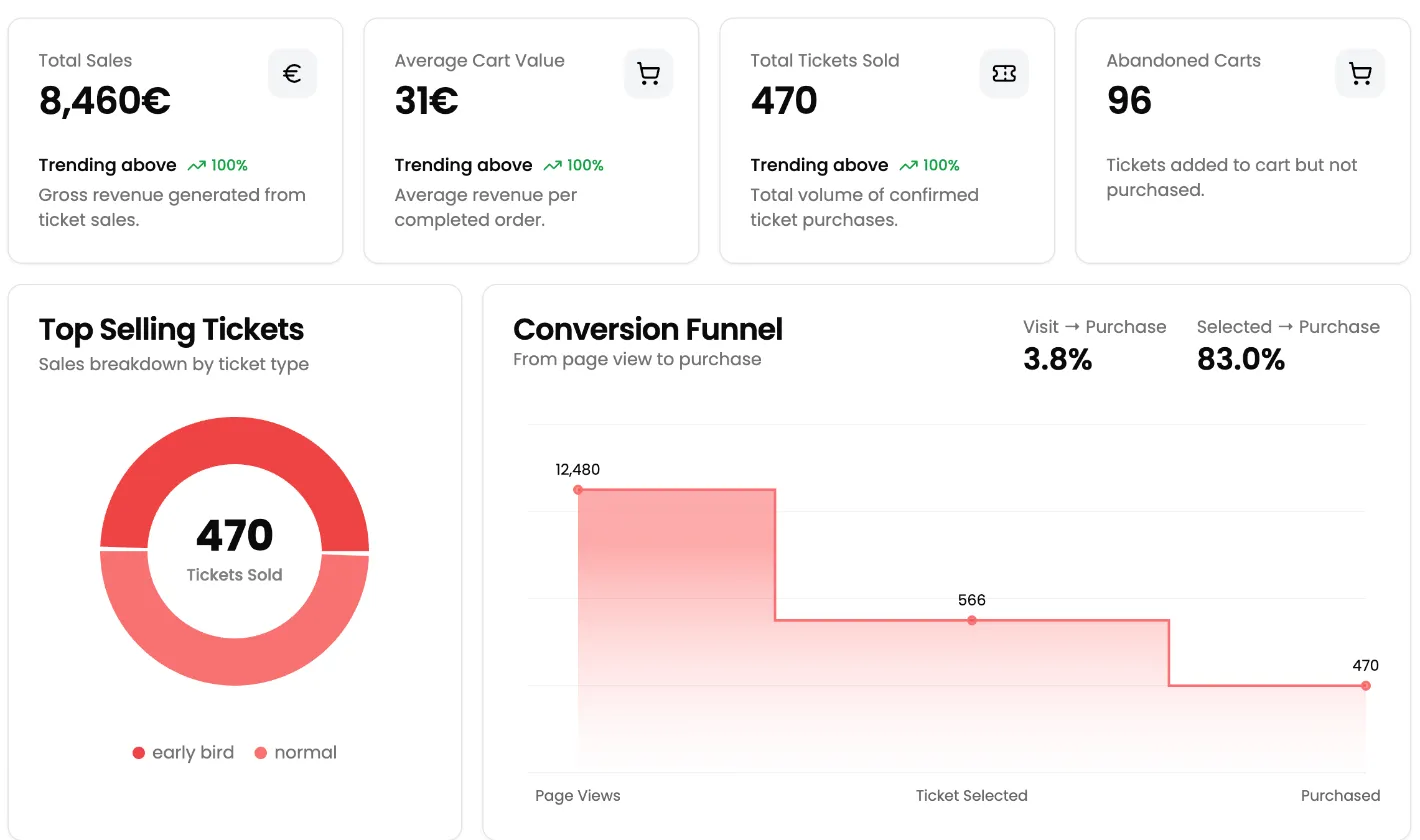
The top cards
Section titled “The top cards”The first three cards, Total Sales, Average Cart Value and Total Tickets Sold, are the same as on the Dashboard: see Sales and traffic.
The fourth card, Abandoned Carts, counts tickets added to a cart that were not paid for. A ticket is added to a cart when the buyer picks quantities and confirms that choice in the purchase window, or clicks a seat on a seating plan. It counts as abandoned if:
- the buyer closed the window or left the page;
- the cart hold expired;
- the payment failed;
- the purchase is still in progress when you look at the view.
The count is in tickets: an unpaid cart of 3 tickets adds 3.
Top Selling Tickets
Section titled “Top Selling Tickets”The Top Selling Tickets donut splits paid tickets by ticket type. The total in the middle, Tickets Sold, matches the Total Tickets Sold card.
Tickets are grouped by name, ignoring upper and lower case, and names are shown in lower case: “Early bird” appears as “early bird”. Two tickets with the same name are added together.
Until a ticket is sold, the card shows No tickets sold yet.
The conversion funnel
Section titled “The conversion funnel”The Conversion Funnel chart follows three steps:
| Step | What it counts |
|---|---|
| Page Views | Displays of your ticketing page. |
| Ticket Selected | Tickets added to a cart, whether paid or not. |
| Purchased | Paid tickets. |
Two rates appear in the top right corner:
- Visit → Purchase: paid tickets divided by page views.
- Selected → Purchase: paid tickets divided by tickets added to a cart.
Until the page gets a visit, the chart shows No data yet.
Reading the funnel
Section titled “Reading the funnel”- Many views, few tickets selected: the page does not make people want to buy, or the buy button is hard to spot. Rework the page in the editor.
- Many tickets selected, few purchases: buyers drop off during the form or the payment. Check the length of your checkout form (custom fields) and the checkout steps.
Attendance rate and check-ins
Section titled “Attendance rate and check-ins”The attendance rate and the hourly check-ins are in the event’s Dashboard:
- Attendance Rate: the share of the event’s attendees whose entry was validated by a scan. All attendees count, including those added by hand or imported.
- Check-ins by time slot: the number of validated entries hour by hour, to spot the arrival peak and size your welcome team for the next edition.
Both fill in when your team scans tickets with SweeScan: see Scan tickets.