
Sales and traffic of an event
Two SweeAnalytics views sum up an event’s activity: the Dashboard for sales, and Impressions for visits to your ticketing page. Open them from the left menu, under the event’s name.
The Dashboard
Section titled “The Dashboard”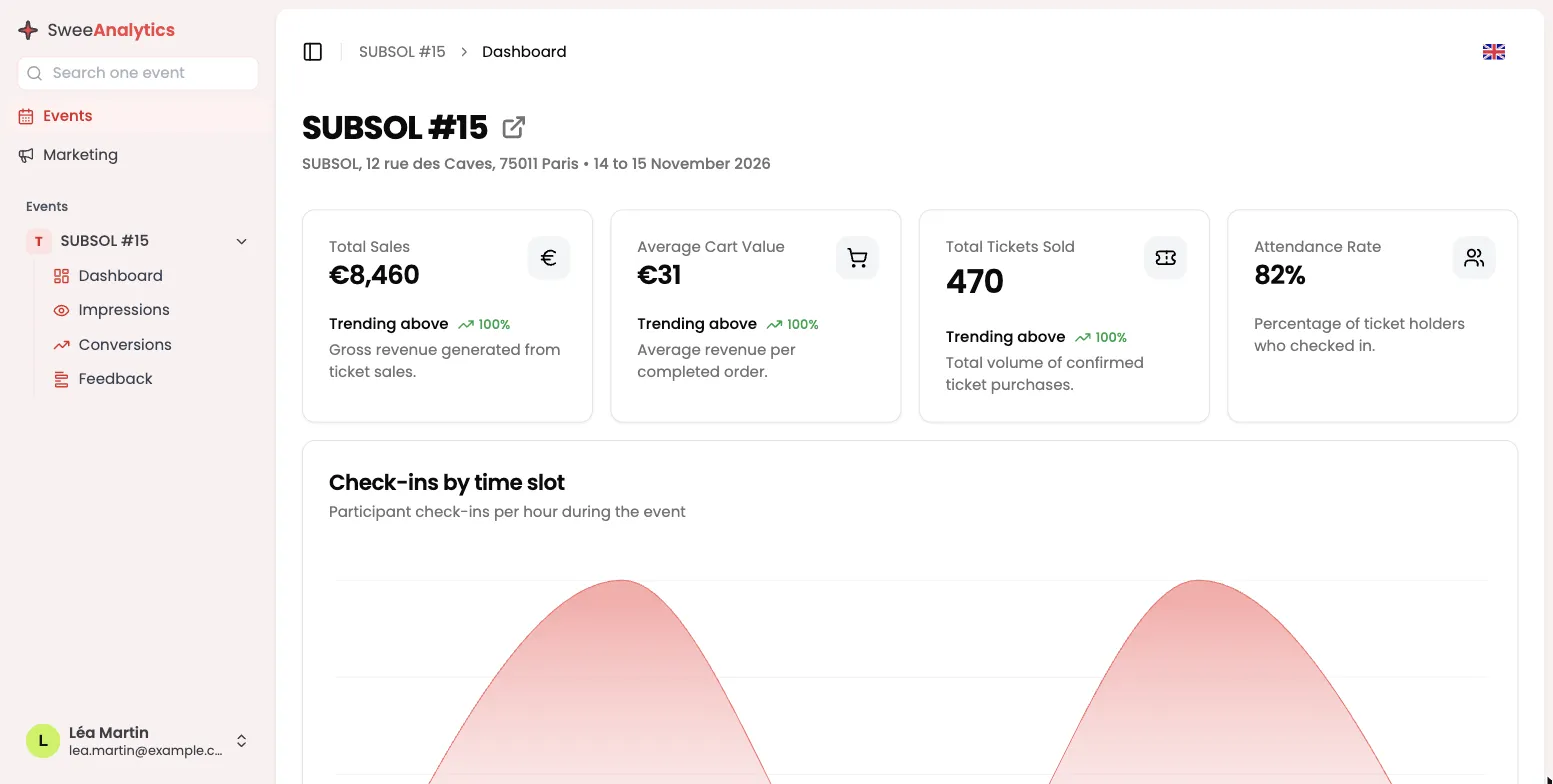
The header shows the event’s name, address and dates, preceded by its photo if the event has one. The icon next to the name opens the event in the dashboard, in a new tab.
Four cards follow:
| Card | What it measures |
|---|---|
| Total Sales | The tax-inclusive amount paid for confirmed tickets, after discount codes. |
| Average Cart Value | Total sales divided by the number of confirmed orders, rounded to the euro. |
| Total Tickets Sold | The number of paid tickets. An order of 4 tickets counts as 4. |
| Attendance Rate | The share of the event’s attendees whose entry was validated by a scan. |
A ticket only counts once its payment is confirmed. A cart in progress or abandoned does not appear here: it is counted in the Conversions view.
The trend under the cards
Section titled “The trend under the cards”Under Total Sales, Average Cart Value and Total Tickets Sold, a Trending above or Trending below line followed by a percentage compares the event with your other events. The reference is the average of your other events that had confirmed sales over the last month.
Hourly check-ins
Section titled “Hourly check-ins”The Check-ins by time slot chart counts, hour by hour, the attendees whose entry was validated with the SweeScan app. It starts one hour before the first entry and ends one hour after the last one. It stays empty until someone is scanned. See Scan tickets.
The Impressions view
Section titled “The Impressions view”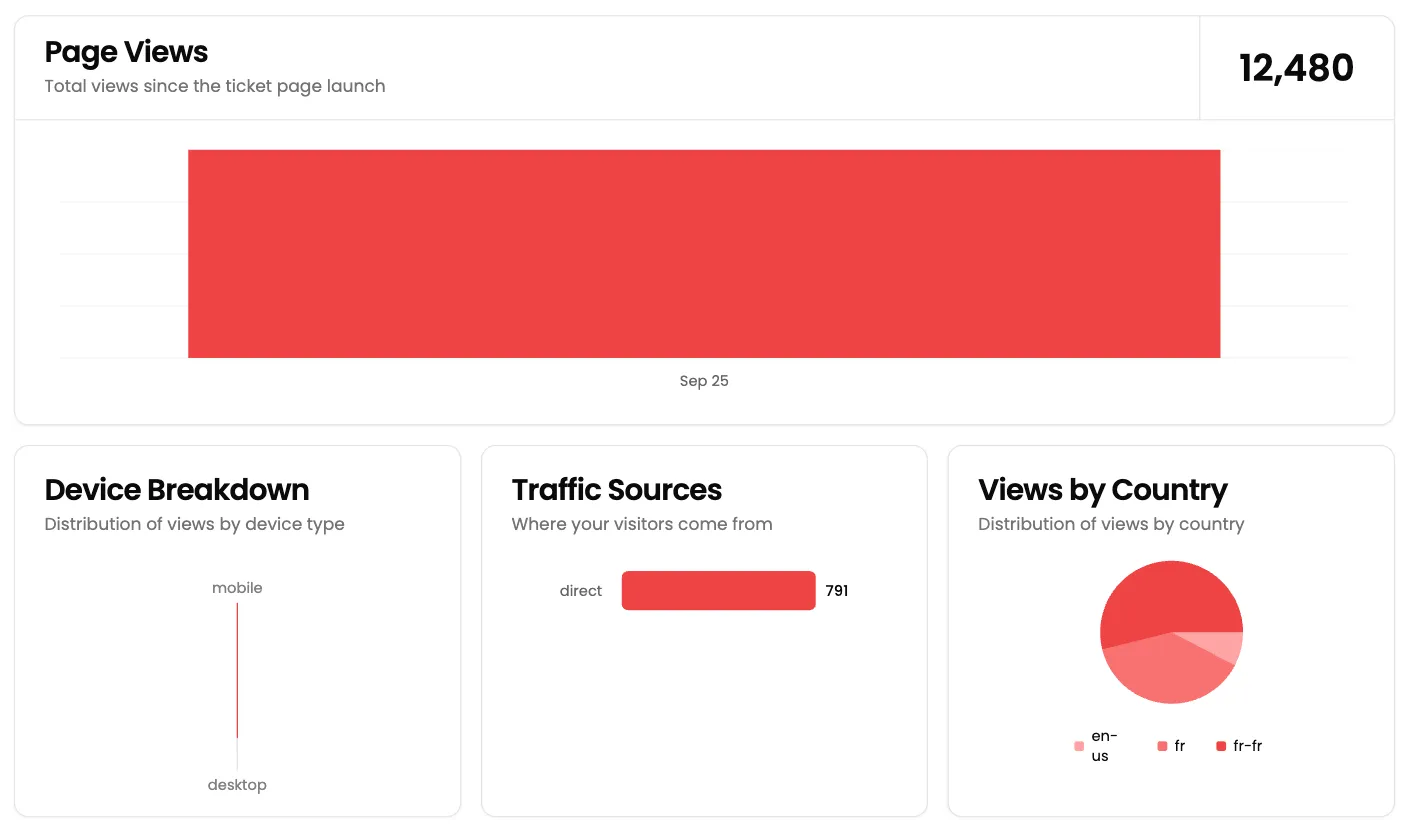
Page Views
Section titled “Page Views”The Page Views card shows the total number of times your ticketing page was displayed, and a day-by-day bar chart.
Every display of the page counts: a visitor who reloads the page or comes back the next day is counted several times. The page preview in the editor is not counted.
Device Breakdown
Section titled “Device Breakdown”The Device Breakdown chart splits views by the device type detected by the browser: desktop, mobile, tablet. An unrecognized device is counted as desktop.
Traffic Sources
Section titled “Traffic Sources”Traffic Sources shows where visitors came from, based on the page they were on when they clicked your link:
facebook,instagram,youtube,twitter(including x.com),tiktok,linkedin,whatsapp,snapchat,pinterest;messagefor iMessage and Google Messages;directfor everything else: address typed by hand, link opened from an app that does not pass on its origin, search engine or any other website.
The first four sources are visible; scroll the card to see the others.
Views by Country
Section titled “Views by Country”Views by Country splits views by the visitor’s browser language, as a two-letter code: fr, en, es, de… It is not a location: a Spanish tourist in Paris whose phone is set to Spanish counts under es, a French-speaking Belgian under fr.
- Compare views and sales. Many views and few tickets sold: look at the funnel in the Conversions view to see where visitors drop off.
- Track your ads another way. Traffic sources do not read UTM parameters. For your advertising tools, add their scripts to the ticketing page: see Tracking and pixels.